Which of your wind sites are due for a repower?
A ranked list of the sites in your fleet nearing end of life, aged from turbine footprints and imagery history.
Resolution ≤0.5 mAnnualSatellite or aerialRGB
01. How the repower list gets made now
You manage a wind portfolio, and the register for it lives in a spreadsheet someone started years ago. Each site has a turbine model, a commissioning year, and a lease end that may or may not have been updated after the last amendment. Some rows are complete. Plenty are not, because the model changed in a purchase, or the site came in with an acquisition and the file never followed.
When the question comes up, which sites do we put forward for a repower, an analyst on your team opens a public turbine database, a planning portal and the aerial photo of each site. They count towers, check the layout against the model in the register and make a guess at the era. It is slow, it happens one site at a time, and it can happen late: the lease expiry or the end of a revenue contract is already close, and the consent conversation is starting from behind.
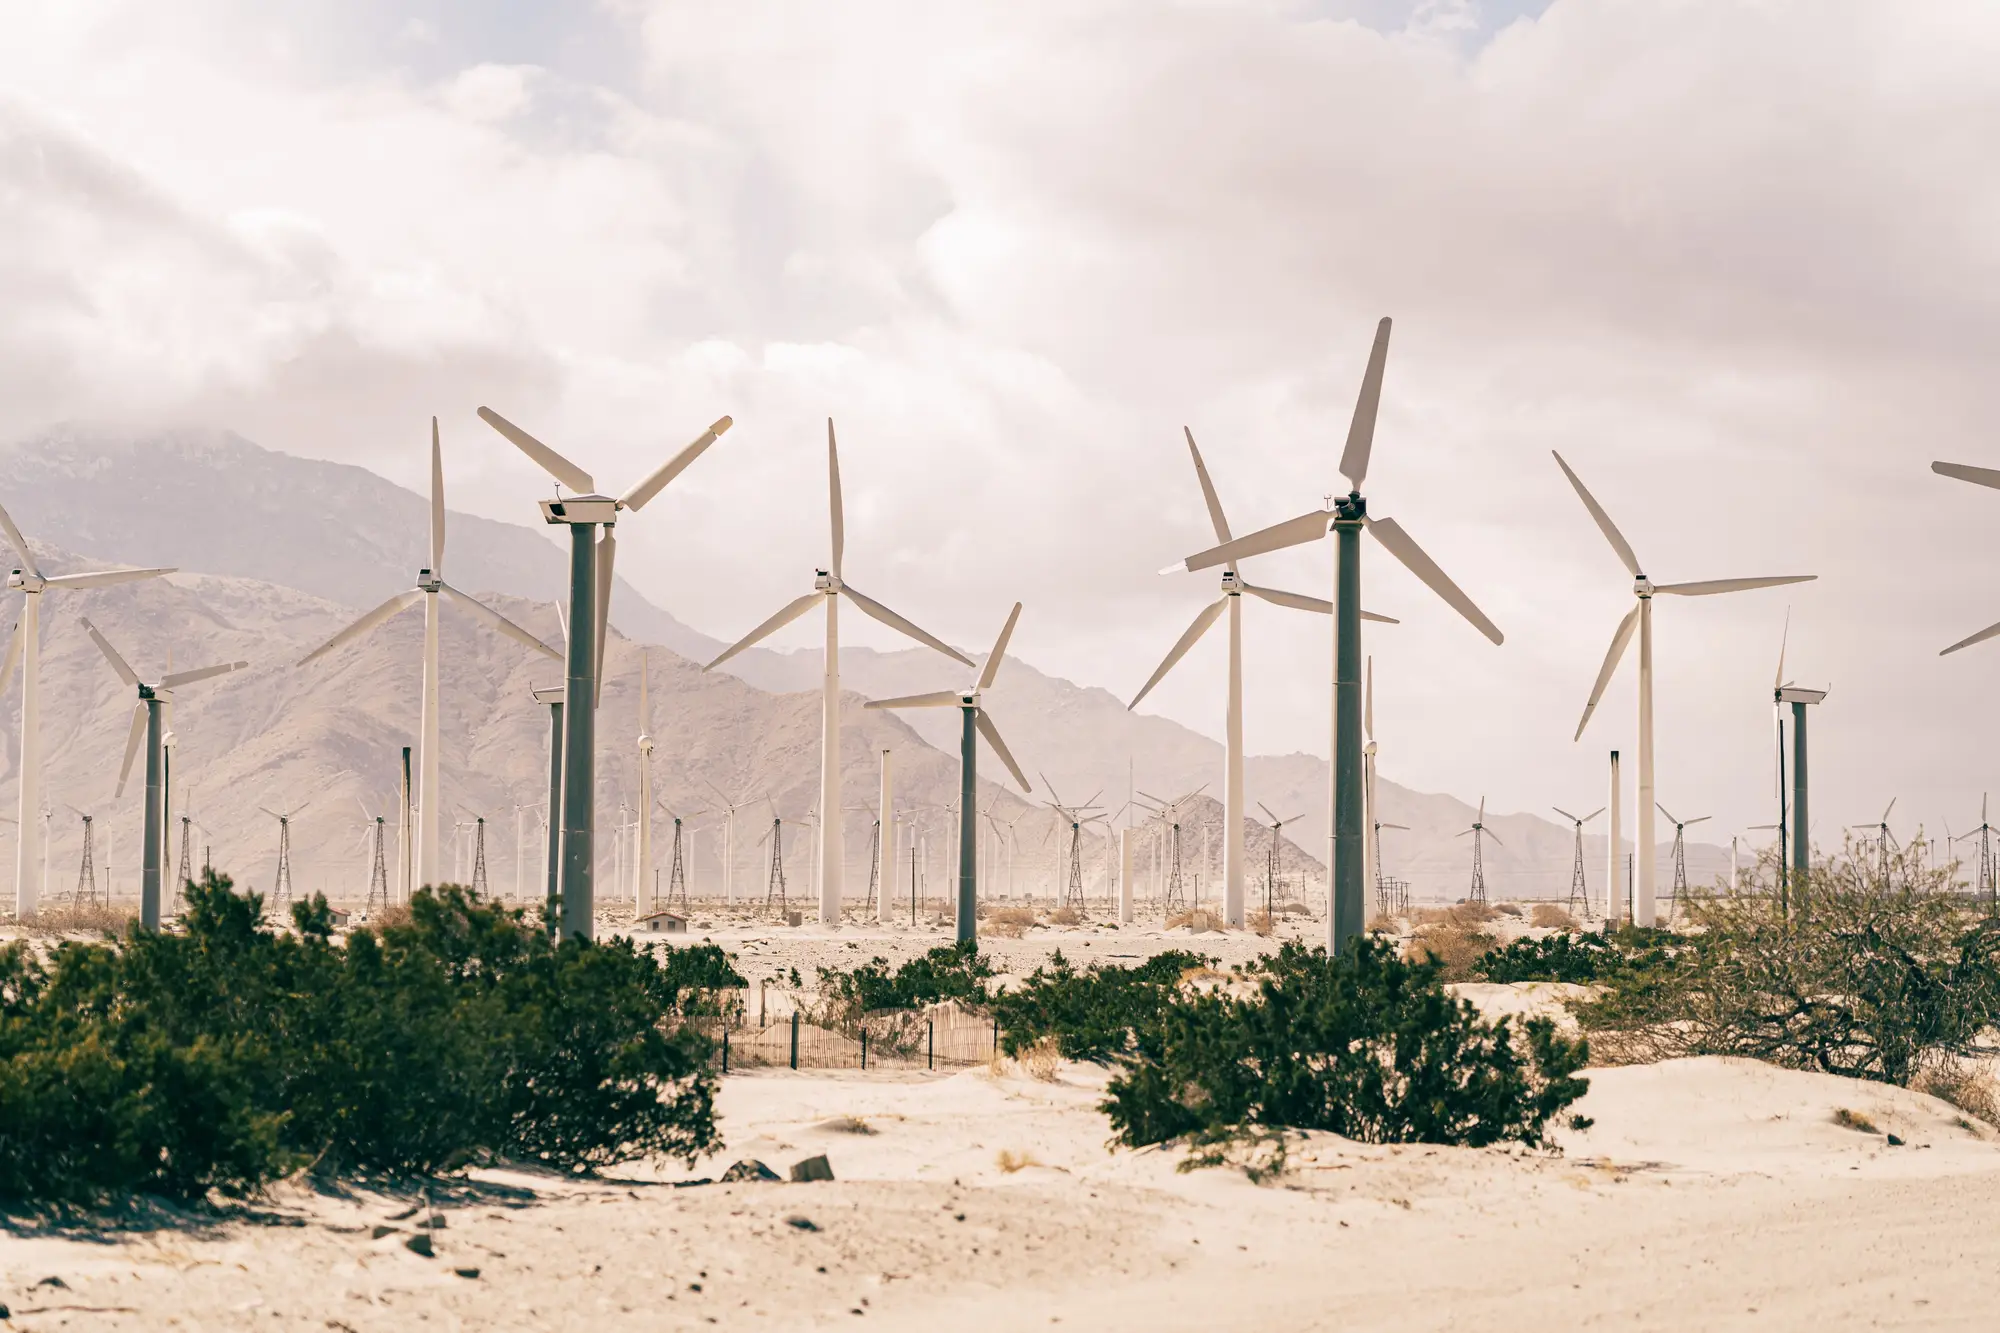
This offer does that cross-check across the whole fleet at once. It reads the turbines from imagery, ages them from their footprint and from how far back they show up in the archive, and hands you the list in an order you can work from.
02. What goes in the log
The first delivery is a pilot over the portfolio or region you pick. After that, an annual pass keeps the record current.
- 2.1
Turbine model footprint per site Site layer
Each turbine matched to a model class from its footprint: tower base, rotor span and the spacing between machines. It lands in your GIS next to the site boundaries. Where a footprint fits several model classes, all are listed.
- 2.2
Estimated nameplate vintage Table column
An install era for each turbine, bracketed by the earliest image in which it appears. It sits beside the commissioning year in your site record, so you can see where the two disagree.
- 2.3
End-of-life window flag Table column
Sites are flagged where the estimated vintage places them in or near the window in which turbines are normally planned for replacement.
- 2.4
Repowering-priority ranking CSV
One row per site, ordered by repowering readiness, built to drop into your repowering pipeline ahead of an engineering assessment. Each row carries the imagery dates it rests on.
03. How it works
- Step 1
Give us the portfolio or region
A list of sites or a boundary. A site register helps, because it lets us compare what the imagery shows with what you already hold.
- Step 2
We pull imagery and its history
The latest very-high-resolution pass for each site, plus whatever archive imagery is available for it.
- Step 3
Footprints are matched and aged
Turbines are located, matched to a model class and dated from the imagery history.
- Step 4
You get a ranked candidate list
The layer, the vintage and window columns and the ranking, with the imagery dates behind each row. A person on the project team walks you through the first list.
04. Where it fits
Use the list before the formal engineering assessment, so the consent conversation starts with the sites most likely to need it soonest. It sits upstream of energy yield work, grid studies and lease talks. It tells you where to look first, and the rest of the work is still yours.
05. Limits
These are the places where an imagery-based age estimate can mislead you. Each is stated again on the list itself.
A model class, not a model
A footprint narrows a turbine to a class. It cannot tell you the serial number, the manufacturer's warranty status or what has been swapped inside the nacelle.
Vintage is estimated
Age comes from footprints and imagery history. It does not come from maintenance records, and it says nothing about mechanical condition or remaining life.
Archive depth varies
The history reaches as far back as imagery of that site exists. A site with thin coverage gets a wider vintage bracket, and the list says so.
Cloud decides the pass
Optical imagery needs a clear view of the site. A cloudy pass is retried at the next opportunity in the year.
One pass a year
You get a point-in-time read of the fleet. Continuous condition monitoring needs data from the turbines themselves.
Consent is out of frame
Consent status and the odds of approval belong to the planning authority. The ranking says how old a site looks. It does not say whether a consent will be granted.
06. Who it's for
Who it's for
- Portfolio managers at wind asset owners deciding which sites to take into a repowering process.
- Repowering teams whose site register has gaps they fill by hand today.
Who it's not for
- Teams that need the exact turbine model, serial number or warranty position of a machine.
- Condition monitoring or remaining-life prediction. That takes data from the turbine itself.
- Consent tracking or planning-status checks.
- A single site where the owner already holds a full record.
07. Questions from the asset team
Can this tell me the exact turbine model?
It narrows each turbine to a model class. Serial numbers and exact variants are outside what imagery shows.
Does it check consent status?
No. Consent is a planning-authority record, and nothing about it appears in a photograph.
How far back does the imagery history go?
As far as archive coverage for that particular site. It differs a lot between sites, and the list shows the earliest usable image for each.
Does cloud cover affect a pass?
Yes. Optical imagery needs a clear view, and a cloudy pass is retried within the annual cycle.
Can it predict remaining turbine life?
No. It estimates vintage from imagery, not mechanical condition.
How do we check it against our own records?
The list carries the imagery dates and the model class for each turbine, so you can compare them with your site register and spot where they disagree. Tell us which sites you trust most and they can serve as the check.
Will it fit our GIS and pipeline?
The layer is built to open in a standard GIS and the ranking as a CSV. We will confirm formats when we scope your portfolio.
Who owns what we deliver, and where does the imagery come from?
Ownership and use terms are written into the agreement before work starts. The imagery comes from archives that keep their own licences.
How is it priced?
During early access, each portfolio is scoped on its own. You get a written scope you can take through procurement.
Log your fleet's vintage.
Tell us which portfolio or region you manage and we will say what a candidate list for it would contain.
Request early access